Note: This post was originally published in June 2016, and updated in July 2018 to include industry benchmark data. Overall engagement trends among the top social platforms have remained relatively steady since the original article was published.
Two recent studies have revealed interesting trends in social media engagement, and it may impact how brands invest their social media time.
Channel, number of followers, and industry are all variables for how often someone engages with a brand’s social media post. The definition of “engagement” can vary by platform, but for most platforms, it’s comprised of a like, share, or comment.
The following is a look at how key variables impact social media engagement.
How Does Number of Followers Impact Social Media Engagement?
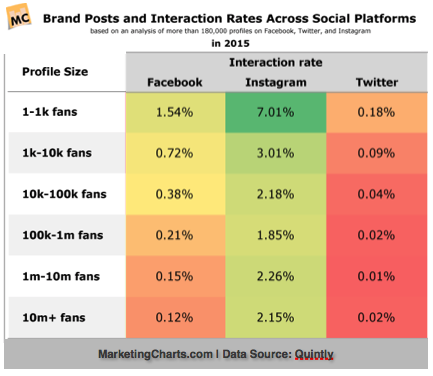
Engagement on all three social channels declines significantly as the number of followers increases. For example, brands can see engagement drop by up to 90% when going from fewer than 1000 fans to over 100,000 fans.
One explanation is a lack of relationship “depth” between the follower and the brand. It is easy to have a meaningful interaction with a small follower base; however, scaling those interactions to a large audience is very difficult. For example, consider how likely you are to get interaction from family members on Facebook compared to a large brand posting new product information for its customers. The family relationship runs much deeper, therefore receives higher interaction rates.
Another explanation is a drop in follower legitimacy as the channel gains more followers. Popular channels can attract automated “bot” social accounts. This increases a channel’s follower count but will never result in meaningful engagement.
Which Social Media Channels Have The Most Engagement?
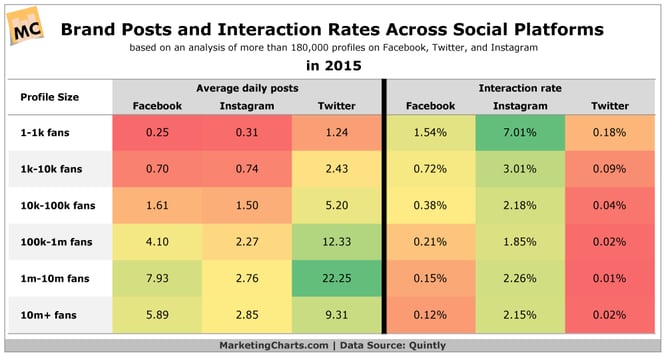
Instagram is by far the most engaged social platform for brands, with 2-7% percent of users interacting with each post. Twitter is the least engaged channel, with less than two out of one thousand followers (<.2%) engaging with each post. Facebook falls between the two, while seeing a significant drop off in engagement rates the higher the number of fans.
With over 300 million active users, Twitter remains one of the most active social media channels; however, its poor engagement rates have been a red flag for advertisers. Despite this, Twitter is still considered a very effective customer service channel, leading to higher posting frequency by brands.
How Does Number of Social Media Followers Influence Post Frequency?
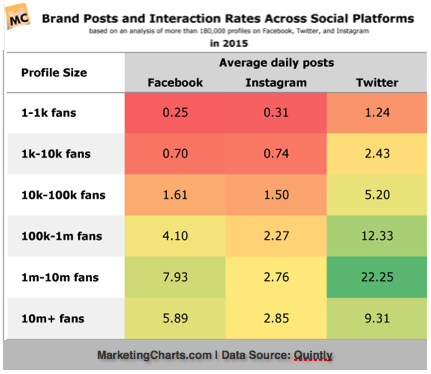
More followers means higher posting frequency. Brands with fewer than 10,000 followers post once to twice per day, while channels with over 100,000 fans post up to 12 times per day.
Companies were also found to update their Twitter far more than any other channel (up to 20 times per day) while Instagram was updated the least (no more than three times per day). The higher frequency can be explained by the channel’s primary form of content. Twitter’s text-based content stream makes it cheap and easy for brands to post. Instagram is image and micro-video based, making content production far more time consuming, while Facebook is a combination of text, image, and video.
Social Media Engagement Benchmarks by Industry
Rival IQ's 2018 Social Media Benchmark Report further breaks down typical engagement rates on the most popular social media platforms across ten of the top industries.
Facebook engagement
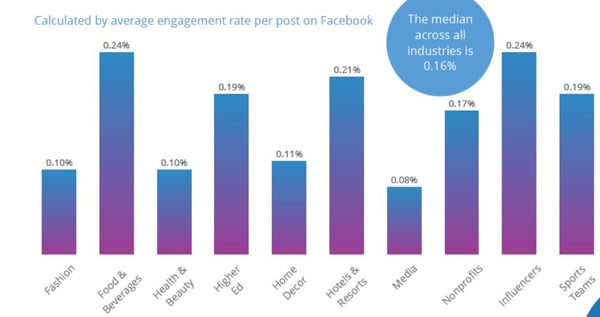
It's interesting to note that while all industries studied averaged around 1 Facebook post per day, with the exception of Media which posts much more frequently, the engagement rate varied quite a bit.
Instagram Engagement
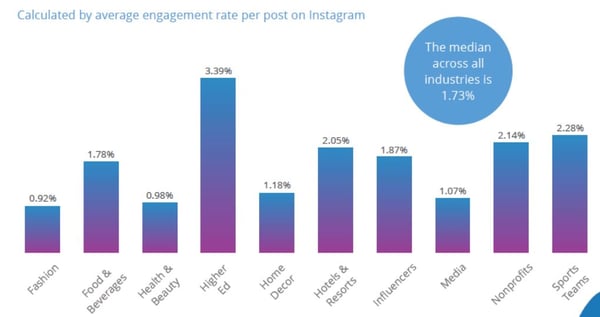
Higher Ed's engagement rate makes sense given the highly targeted audience, despite them posting less frequently on average than many other industries. That industry's Facebook engagement declined from the previous year, although photos and videos had the highest engagement among post types.
Twitter engagement
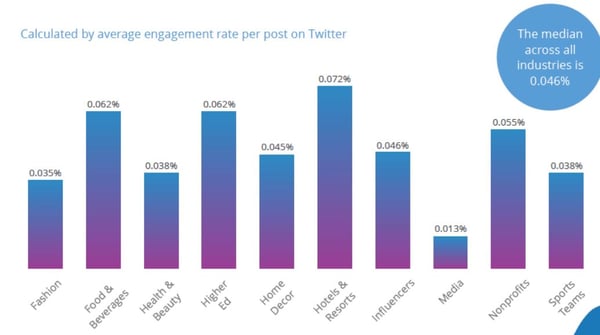
Twitter engagement continues to fall for some of the largest industries, and is showing less consistency across industries than in years past. The average posts per day across industries was 1.12, with the exception of media and sports teams who post an average of 11 times per day. Per post engagement is low across all industries measured.
How Does B2B Social Media Engagement Compare?
Business-to-business (B2B) industries saw similar trends in engagement across the major social platforms. As with the previous study, Instagram saw the highest engagement, with around 2% of all posts receiving some form of engagement. Twitter also found itself at the bottom of the heap, with less than .1% of followers engaging with a post on average.
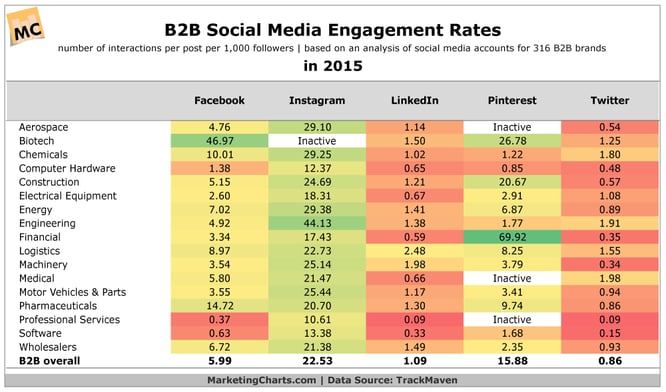
Pinterest was the only channel to experience engagement levels close to Instagram, with 1.6% of users engaging on average. One common thread between these two channels is their emphasis on visual content, suggesting imagery plays a large part in soliciting a reaction from followers.
As brands attract larger audiences on social media, they should look for creative ways to increase engagement. Segmentation, ad boosting, and dark posts are effective ways of increasing relevance, and therefore engagement.
Finally, a channel’s overall proclivity for engagement should be greatly considered when investing in any social channel. Social media channels are, after all, meant to be social.


Agree, disagree, or just have something to add?
Leave a comment below.