I recently wrote about the importance of setting expectations. I explained why they’re so important, how they should be set, and how they can greatly influence our perception of success.
Once we’ve set those expectations, we need a proper way of measuring the results.
In the last year I’ve contributed to WorkIt RIchmond, I’ve written frequently on the importance of using your own website’s analytics to make smarter marketing decisions.
Today I want to share with you one of my favorite reports in Google Analytics. This report solves the problems that have plagued other analytics software for so long. This report understands the buying cycle of the average consumer. This report gives credit when credit is due. This is the multi-channel funnel report.
Pause. I realize I may be about to lose you when I say “multi-channel funnel,” but just stick with me for a minute.
Consider this for a moment: when you are looking to buy something online, how often do you purchase from the first website you see during your first visit? Hardly ever, right? You're likely to browse a few websites before pulling out your credit card. Maybe you can find a better price or maybe someone offers free shipping. And while this is totally normal, totally acceptable, and totally expected behavior, it presents a very significant challenge for online marketers.
That challenge is understanding which marketing channel is responsible for producing a site conversion when visitors come to your website multiple times via multiple channels before converting.
Multi-channel funnel reports helps solve this problem.
Enough talking. Let's look at a real report.
Disclaimer: in order to use multi-channel funnel reports you will need to have goals or ecommerce tracking configured in Google Analytics.
You can access multi-channel funnels from the Conversions section of your Google Analytics.
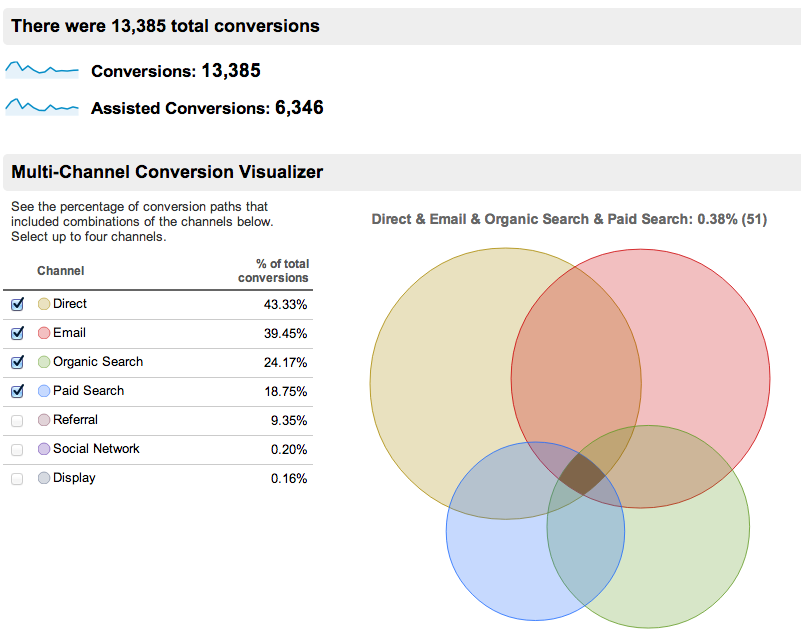
The first report you’ll see is the Overview report. This provides a high-level glimpse of how different channels work together to produce a sale or lead. See below:
At the top, you’ll notice there have been 13,385 total conversions. Directly below this are assisted conversions. An assisted conversion is applied to a channel a visitor came through at some point during their conversion path, but was not the final conversion interaction. For example, if you do a search for “garage door openers”, click on a Sears paid ad but do not purchase, and then go back to the Sears website the following day by typing sears.com into your browser and then make the purchase, the paid search ad is counted as an assisted conversion (I’ll bring more clarity to this concept in just a minute).
At the bottom of this report is a visualization showing how these different channels overlap one another. The darkest shaded area in the center represents the times when someone visited the website from all four channels before converting.
Next up is the Top Conversion Paths report. This report does a wonderful job of further visualizing the different paths users take leading to a conversion. Here’s one scenario that led to six conversions worth $54.65.
This particular path began when someone clicked to the site via an email marketing campaign, then came to the site via a paid search ad, then clicked to the site from a link on another website, and then made a fourth visit from an organic search before finally purchasing.
So how can this information be helpful? First, we need to give credit to our email marketing campaign. After all, it was our email campaign that first brought this person into the site. From there, these visitors utilized our paid search ads, our affiliate partners (referrals), and ultimately our organic search engine rankings. All in all, it was a great team effort.
Now, compare this to the old way of measuring conversions, when all we knew was this:
So much for a team effort. The SEO team gets all the credit for the conversions and email marketing goes on the chopping block during next month’s marketing meeting.
Are you starting to see the value of multi-channel funnel tracking?
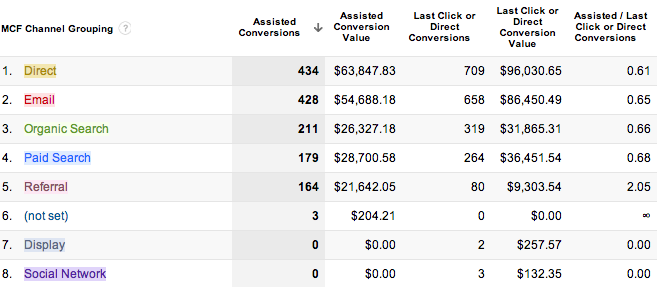
The last multi-channel report I want to show you is my favorite of the group. In fact, I’ve thrown all other conversion reports to the side in favor of this one report. It is called the Assisted Conversions report, and it looks like this:
The purpose of this report is to summarize how often channels helped lead to a conversion versus how often they led directly to a conversion.
For example, the Paid Search campaign assisted in 179 conversions over this time period. That means the paid search ads played some role in the consumers’ journey to making a purchase. Meanwhile, there are 264 “last click” or “direct” conversions associated with paid search. This means there were 264 instances where someone clicked a paid search ad and then converted during that visit.
Going down the list, Referral traffic stands out. This is the only source that assists in a conversion more often than it leads directly to a conversion. In other words, the referral traffic is better at creating the introduction than it is closing the sale.
Understanding the concept of assisted conversions can completely change our perception of where and when success occurs. If you are interested in the accountability of your marketing campaigns (and if you’ve read this far, I have to think you are), stop focusing only on last click attribution and start measuring multi-channel attribution. You may just be surprised by what you find.


Agree, disagree, or just have something to add?
Leave a comment below.