We use BaseCamp from 37signals for general work time tracking, including project development. Over time there can be a large amount of data accumulated, and there is a nifty way it can be consolidated and used for project analysis. In essence, export the time data out of BaseCamp and use the power of Excel to make summaries and graphs. In this way, you can easily see items such as:
- project performance relative to budget
- breakdown of project steps (prep, graphic design, site shell development, copywriting, content integration, etc.) by total hours and percent of project
- trends over time
- performance by employee
Here are the basic steps I took:
- From the BaseCamp Time control panel, export all history in 6-month intervals (BaseCamp will allow the export of a maximum of 6-months at once)
- Merge these exported CSV files in Excel, saving as a regular spreadsheet.
- Important: Keep the order of the exported columns as is. This will enable you to add updates as needed (weekly, monthly, etc.) by simply pasting in new updates at the bottom of the raw data.
- You can now add a few additional columns to the right of the imported data. One of the most important will be a field to be used as a flag for the type of activity. For example, you could use "S" for site coding (skinning), "C" for content integration, etc. Plan out what you want to do in advance with as few or as many flags as needed.

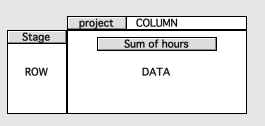
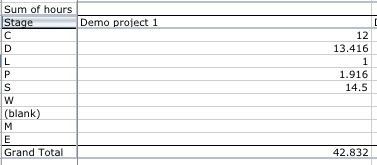
- Create a new sheet in the Excel workbook. This will contain a Pivot Table to summarize the raw data. In the one I developed, projects are the column headings and the flag values (Stage) as the row headings, with a summation of hours as the data in the middle. The following image shows how you can configure the Pivot Table layout to show a summation of hours for each project, segmented by the project activity flags you inserted into the BaseCamp downloaded data. Excel Pivot Tables are great because they allow a tremendous amount of data to be quickly segmented according to desired criteria.
[caption id="attachment_275" align="alignnone" width="265" caption="Pivot table layout"]

[/caption]
- Create a third sheet which will be the main summary page. In the first column of this sheet, paste all of the project names, exactly as copied from the main listing in BaseCamp. It is very important that these project names exactly match the ones that are in the pivot table. In the first row, create column headings such as Project, % Budget, Budget, Preliminary (hr), Preliminary (%), Design (hr), Design (%), Total Project (hr), Total Non-project (hr), Grand Total, etc. You can make as many columns as you want. You will need to manually fill in some information for each project such as the budgeted hours, etc. This example shows some sample project data in the summary project sheet. I'll show in the next step how to bring over the summarized info from the Pivot Table.

- Use the Excel HLOOKUP command to extract pertinent information from the pivot table sheet for each project, referencing the appropriate Flag value in the left-most pivot table column. This image shows an example of a HLOOKUP formula which can seem a bit intimidating at first glance. The command simply scans across the Pivot Table column headings (Projects) looking for a match. Once found, the corresponding value in the row number of the pivot table is returned. Build the formula once, then replicate it to the other cells. I used a combination of absolute and relative addressing to make it easier for me to carry the formula over to other columns.

- Now you can add calculations in the summary sheet columns such as the ones showing percentages. Calculate these, referencing the values you brought over from the pivot table sheet.
- Important: Keep all calculations active. This will allow you to refresh the pivot table when new raw data are added, and the summary sheet and any graphs will update automatically.
- I sorted my summary sheet according to budgeted hours in descending order.
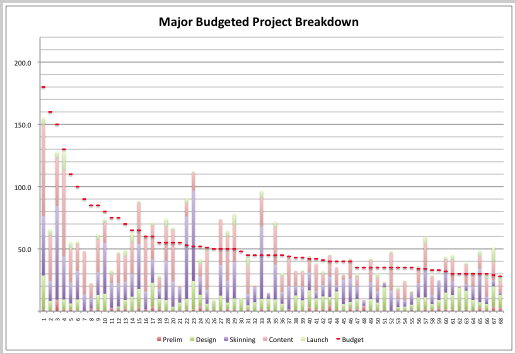
- Create a stacked column graph on a new worksheet with hours as the vertical axis and projects along the horizontal axis. The components of the columns will be the values corresponding to Preliminary, Design, Skinning, etc. for each project. In my chart, I changed the graph type for the Budget data series to that of a line graph, with no interconnecting lines. In doing this, the result was a superimposed horizontal tic mark on project column corresponding to the budgeted number of hours. There likely will be shown some projects that are under budget and some that are over. The nice thing is that you now have a means to review at a glance many projects at once.

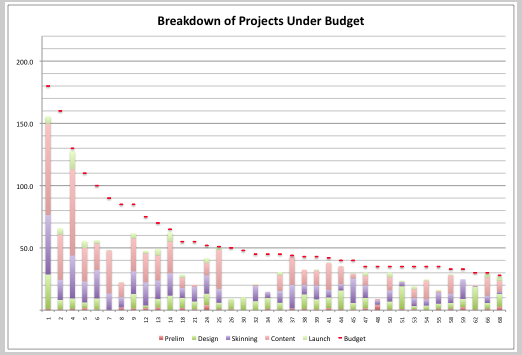
- Here is the fun part! Go back to your Summary sheet and use the autofilter command. This allows you to customize what is shown in the summary. For example, you can customize the Budget % column to only show projects where the value is greater than 1.00 (in other words, showing projects that have run over budget). When you switch back over to your graph sheet, it will automatically recalculate and update, only plotting the projects that are over budget. You can actually drill down quite extensively into your projects, using the graph sheet to visually show you the results. Here as an alternative, I am showing only projects under budget. New graphs can be generated on the fly in only a few seconds.

I update my workbook each week with new data exported from BaseCamp, and use it as an effective tool in project management and production planning. It allows areas to be identified where improvements in process efficiency are needed as well as providing solid input to Sales for estimating new projects.


Agree, disagree, or just have something to add?
Leave a comment below.