A few months ago, we embarked on a mission to better understand how users in central Virginia used the internet.
To do this, we surveyed users throughout central Virginia, then broke down that information by age, gender, and income.
Our previous post focused on how income level impacts online behavior. Today, we’re going to look at how someone’s age impacts their behavior online.
Keyword Searches
When searching for a plumber, the most common keyword search for all age groups is “plumber in Richmond.” Older demographics were more likely to search using their specific town or suburb (e.g. Midlothian), while those younger than 45 years old would search using the main metro area (Richmond).
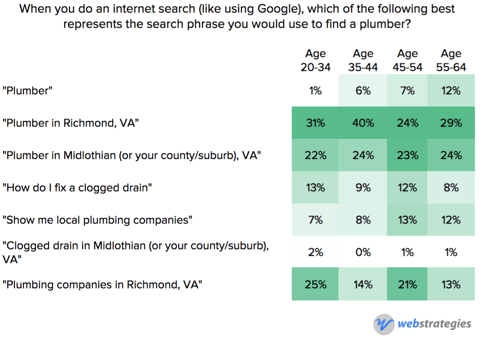
“Show me” searches (e.g. “show me local plumbing companies”) are used by less than 14% of every age group. Surprisingly, the youngest age demo in our study (20-34) was least likely to search using a “show me” phrase (7%). “Show me” searches are generally considered more popular amongst younger demographics, however our data does not support this.
Searching on Internet Versus Asking For Referrals
When asked how likely you are to search online versus ask for a referral, all but one age group claim to do so equally (the 45-54 age group relies slightly more on referrals than an internet search).
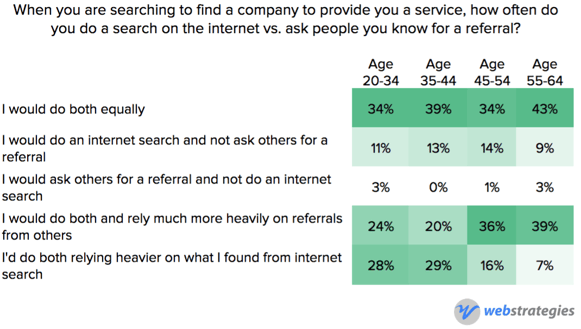
Our data showed age impacts someone’s likelihood to trust referrals over the internet, and vis versa. Respondents younger than 45 are more likely to rely on internet research over a referral (in some cases, they are four times more likely), while those 45 and older are nearly double as likely to rely on personal referrals.
Paid versus Organic
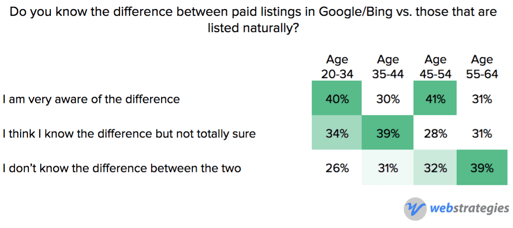
The older the individual, the less likely they are to know the difference between paid search listings and organic search listings. Only 26% of those 20-34 don’t know the difference, compared to 39% of those 55-64. For businesses targeting an older demographic, this could make paid search marketing an even more viable strategy.
Hours Spent Watching TV Per Day
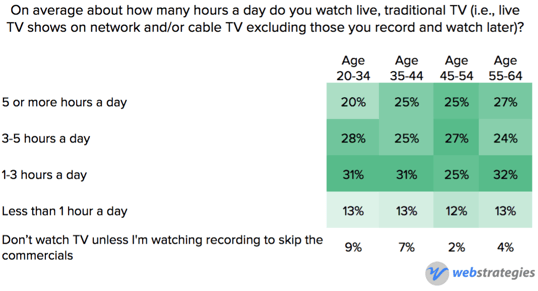
Age appears to have little impact on how often someone watches traditional TV. Over 75% of every demographic watches at least one hour per day, and over 50% watches at least three hours per day. So while internet usage has increased over the last decade, television consumption remains pervasive. This also supports the notion that individuals watch TV while browsing the web simultaneously.
Hours Spent Online Per Day
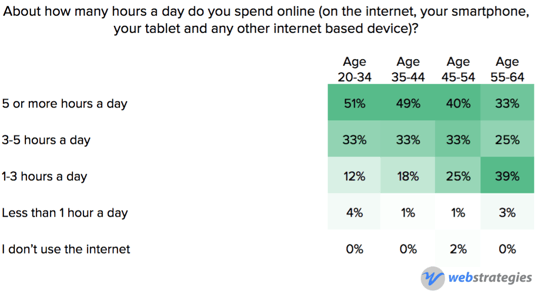
Frequent internet usage, amongst all age demographics, is pervasive. Approximately 50% of those 20-44 spend five or more hours per day on the internet (via a smartphone, tablet, or desktop computer). This percentage decreases as the individual gets older, as only 33% of those 55-64 spend more than five hours per day online. The 55-64 age demographic is most likely to spend 1-3 hours online per day (39%).
Less than four percent of every age demographic say they spend less than one hour per day online.
Using A Company Specific Mobile App
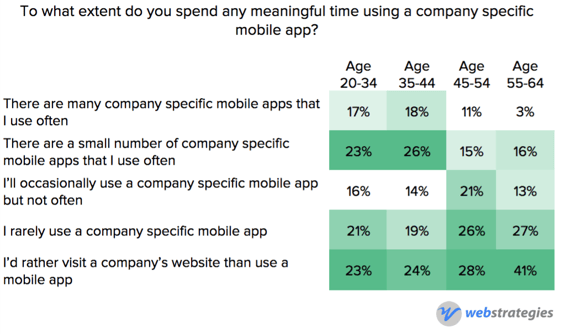
Those younger than 45 are nearly twice as likely to use a company specific mobile app. Amongst all age demos, users are most likely to only use a small number of company specific apps, or use none at all.
For businesses who are considering a mobile app, realize it’s a very competitive market with relatively low demand. To achieve meaningful ROI, your app must offer utility beyond what a mobile website can easily accommodate.
Visiting a Website That’s Not Mobile Friendly
You’re more likely to annoy a younger user with a non-mobile friendly website than an older user. 28% of those 20-34 years old said they’d leave a non-mobile friendly website for one that is mobile friendly, compared to about 12% of those 45 and older.
39% of those 55-64 claim to not own a smartphone at all, far more than any other age demographic. Less than 10% of those younger than 45 claim to not own a smartphone.
How helpful are Consumer Reviews?
50-65% of every demo actively seeks out reviews, or consider reviews a very important part of their buying decision. Less than 6% of every age group discredits them entirely.
Younger users (younger than 35) are twice as likely to use social media to check reputation than their older older counterparts.
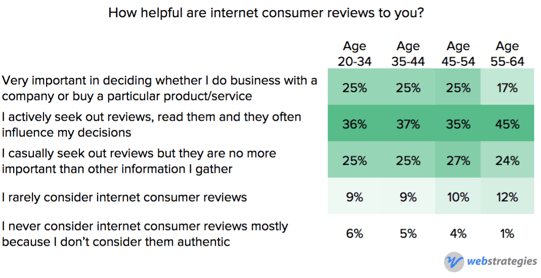
Nearly 50% of every age and income segment are impressed by strong reviews, but wonder if the reviews are legitimate. This speaks to the importance of having authentic reviews, and why negative reviews can positively impact the overall perception of your reviews.
Reading Emails From Local Companies
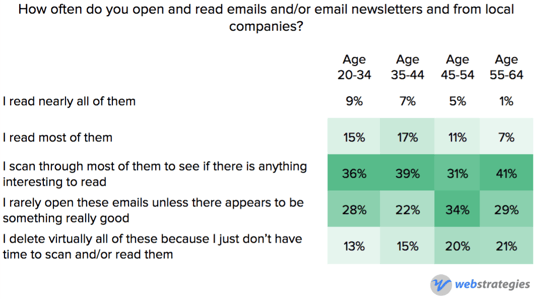
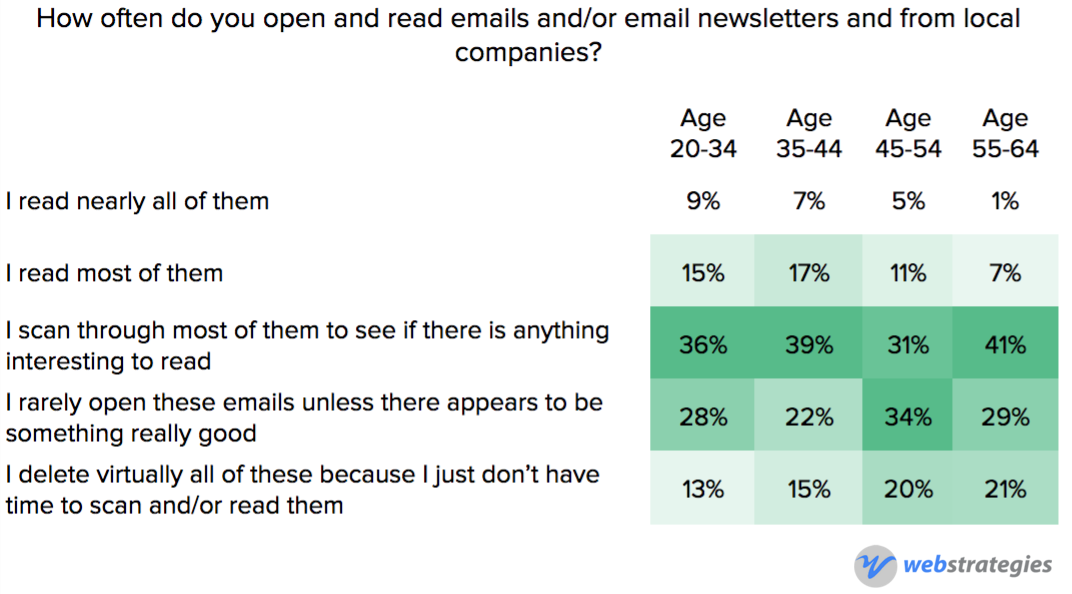
Older recipients (those older than 45) read e-newsletters at half the rate of their younger counterparts. This older demographic is also 25% more likely to delete the emails entirely due to lack of time.
Promotional newsletters are at least scanned by 50% of recipients, regardless of age.
Social Media Site Usage
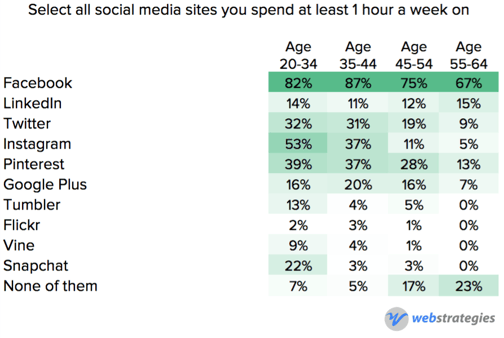
Facebook is the most popular social media channel for all ages. Younger demographics are far more likely to use other social media channels as well. Instagram, the popular image sharing app, is used by more than 50% of those younger than 35. Snapchat is also gaining in popularity, but is still limited to the youngest age group in our study. In central Virginia, Snapchat is used by 22% of those under 35, but hardly used by anyone older (3% or less).
23% of those older than 55 claim to not use any social media whatsoever, and there was not one social media channel from our study which saw increased usage the older the user.
In summary, the age of the individual has a significant impact on how they use the internet. This can be explained by a number of factors, but most likely lifestyle and familiarity with the internet and technology. Younger users are early adopters with social platforms (unsurprisingly), and are more likely to consume the most information (including e-newsletters). The older the individual, the more selective they are in regards to the platforms the use and the marketing they engage with.




Agree, disagree, or just have something to add?
Leave a comment below.