Neal Lappe - July 3, 2011
Google released recently their latest data about online marketing conversion rates. This article provides additional data about some of the top online conversion rates, a perspective about the trends, and some advice about what you can do to maximize your conversion rates.
First let's define Conversion Rate (CR%). CR% is calculated by dividing the number of desired actions taken (Conversion Goal) by the total number of website visitors during that same timeframe. For example, let's say you sold 10 products (goal conversions) and had a total of 500 visitors during that same period. Your conversion rate would be 2%.
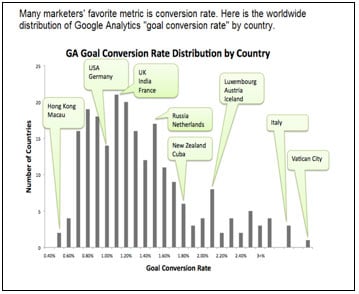
 The graph to the left shows Goal Conversion Rates by country. For those of us in the great USA, average conversion rate runs around 1%. That’s pretty low in the scheme of things.
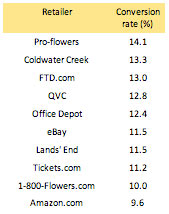
 There are many sites that convert in the double-digit range, which is considered exceptional. The next chart lists the best converting websites, and as you can see, the best ones are very well known brands. Additionally, this data represents the holiday selling season when we would expect conversion rates to be higher than normal.
When you combine the higher than normal conversion rates during the holiday selling season with the fact that Amazon.com, the site that many consider the "gold standard" for website performance, converted at high single-digits, that overall 1% conversion rate doesn’t seem as abnormal as many would think.
So what does one do to improve online marketing conversion rates and maximize marketing return-on-investment?
If more online marketers focused their efforts on studying visitor intent and website optimization, instead of just driving traffic, their average conversion rates would be much, much higher. Think about ways you can add value to a visitor’s experience and/or give a visitor more reason to convert. After all, those clicks are usually real people. They arrive with needs, desires, and motivations. Commit yourself to addressing them in your product offerings, and copy.
Set up "Persuasive Scenarios"
Think about what your website visitors want, what problems or challenges they are working to solve and then create "persuasive scenarios" that specifically address those desires, problems and challenges. For example, if you provide home health care or companion care, it is quite probable that a loved one is seeking a trusted, caring provider that the visitor would feel comfortable coming into the home. Perhaps you would show the visitor some testimonials, pictures of some of the care providers, minimum care giver requirements and the steps taken to evaluate customer satisfaction. Reviews could be huge in this case. At that point, perhaps give the visitor an easy way to request service as well as get more information, if desired. Just as you'd hire the best salespeople to staff your store on 57th and Main St., invest some money in creating a persuasive online experience.
Use Google Analytics to Measure Marketing Navigation and Goal Conversion
Identify how you will get the visitor from "point of entry" in your website (where they entered your website) to "online conversion" (your desired action for a website visitor). Then, use Google Analytics to identify targeted navigation and goals so you can track visitor navigation through each specific step in the online conversion process. Use this data to identify where the navigation process is succeeding and breaking down. Use this valuable data to refine your “persuasive scenario”.
In summary, converting in the 1-2% range might be considered OK, but the impact of raising that 2% conversion rate to 3% can be just huge in terms of lead generation and revenue. Investing good money to drive traffic to your website without consciously establishing and measuring “persuasive scenarios”, can be like throwing good money after bad. Analyze and understand your targeted website visitors. Decide what they want from you. Give them what they want and see your online conversions increase.


Agree, disagree, or just have something to add?
Leave a comment below.